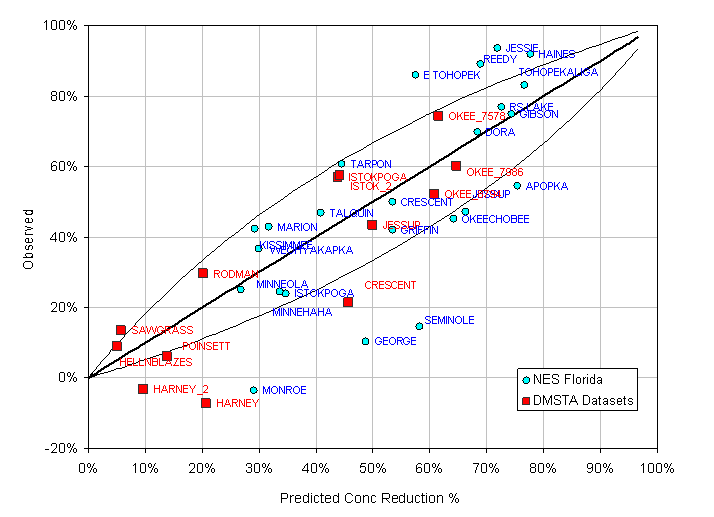
| Steady-State Model Applied to DMSTA Calibration Lakes
& Other Florida Lakes |

|
|
|
|
|
|
|
|
|
|
|
|
|
|
|
|
|
|
|
|
|
|
|
|
|
|
|
|
|
|
|
|
|
|
|
|
|
|
|
|
|
|
|
|
|
|
|
|
|
|
|
|
|
|
|
|
|
|
|
|
|
|
|
|
|
|
|
|
|
|
|
|
|
|
|
|
|
|
|
|
|
|
|
|
|
|
|
|
|
|
|
|
|
|
|
|
|
|
|
|
|
|
|
|
|
|
|
|
|
|
|
|
|
|
|
|
|
|
|
|
|
|
|
|
|
|
|
|
|
|
|
|
|
|
|
|
|
|
|
|
|
|
|
|
|
|
|
|
|
|
|
|
|
|
|
|
|
|
|
|
|
|
|
|
|
|
|
|
|
|
|
|
|
|
|
|
|
|
|
|
|
|
|
|
|
|
|
|
|
|
|
|
|
|
|
|
|
|
|
|
|
|
|
|
|
|
|
|
|
|
|
|
|
|
|
|
|
|
|
|
|
|
|
|
|
|
|
|
|
|
|
|
|
|
|
|
|
|
|
|
|
|
|
|
|
|
|
|
|
|
|
|
|
|
|
|
|
|
|
|
|
|
|
|
|
|
|
|
|
|
|
|
|
|
|
|
|
|
|
|
| Model: |
R = K'
/ ( K'
+ Q ) |
|
|
|
|
|
|
|
|
R
= reduction in flow-weighted mean concentration (considers atmospheric
deposition) |
|
|
Q = hydraulic load (m/yr) |
|
|
|
|
|
|
|
K' = net
settling rate for steady-state model (m/yr) |
|
|
|
|
|
|
|
|
|
|
|
|
Residual |
|
| Lines
- predicted concentration reduction with K =
1.4, 2.8, 5.6 m/yr |
|
|
Std Error |
|
| Red symbols - DMSTA
calibration datasets |
|
|
|
|
14% |
|
| Blue
symbols - lakes sampled in USEPA National Eutrophication Survey (1973) * |
19% |
|
| Lakes with inflow P
concentration < 1000 ppb |
|
|
|
|
|
|
|
|
|
|
|
|
|
|
|
|
| *
U.S.E.P.A., "A Compendium of Lake & Reservoir Data Collected by the
National Eutrophication Survey in Eastern, North-Central, & Southwestern
United States", Working Paper No. 475, Corvallis Environmental
Research Lab and Environmental Monitoring & Support Lab, Las Vegas,
September 1978. |
|
|
|
|
|
|
|
|
|
|
| 12/5/2006 |
|
|
|
|
|
|
|
|
|
|
|
|
|
|
|
|
|
|
|
