| Index of Design Cases |
File: |
test_data.xls |
|
|
Series: |
STA-2 |
|
|
|
|
|
|
|
|
|
|
|
|
|
| 6/8/2002 |
|
|
|
|
|
|
|
|
|
|
|
|
|
|
|
|
|
|
|
|
|
|
|
|
|
|
|
|
|
|
|
|
|
|
|
|
|
|
|
|
|
|
|
|
|
|
|
|
|
|
|
|
|
|
|
|
|
|
|
|
|
|
|
|
|
|
|
|
|
|
|
|
|
|
|
|
|
|
|
|
|
|
|
|
|
|
|
|
|
|
|
|
|
|
|
|
|
|
|
|
|
|
|
|
|
|
|
|
|
|
|
|
|
|
|
|
|
|
|
|
|
|
|
|
|
|
|
|
|
|
|
|
|
|
|
|
|
|
|
|
|
|
|
|
|
|
|
|
|
|
|
|
|
|
|
|
|
|
|
|
|
|
|
|
|
|
|
|
|
|
|
|
|
|
|
|
|
|
|
|
|
|
|
|
|
|
|
|
|
|
|
|
|
|
|
|
|
|
|
|
|
|
|
|
|
|
|
|
|
|
|
|
|
|
|
|
|
|
|
|
|
|
|
|
|
|
|
|
|
|
|
|
|
|
|
|
|
|
|
|
|
|
|
|
|
|
|
|
|
|
|
|
|
|
|
|
|
|
|
|
|
|
|
|
|
|
|
|
|
|
|
|
|
|
|
|
|
|
|
|
|
|
|
|
|
|
|
|
|
|
|
|
|
|
|
|
|
|
|
|
|
|
|
|
|
|
|
|
|
|
|
|
|
|
|
|
|
|
|
|
|
|
|
|
|
|
|
|
|
|
|
|
|
|
|
|
|
|
|
|
|
|
|
|
|
|
|
|
|
|
|
|
|
|
|
|
|
|
|
|
|
|
|
|
|
|
|
|
|
|
|
|
|
|
|
|
|
|
|
|
|
|
|
|
|
|
|
|
|
|
|
|
|
|
|
|
|
|
|
|
|
|
|
|
|
|
|
|
|
|
|
|
|
|
|
|
|
|
|
|
|
|
|
|
|
|
|
|
|
|
|
|
|
|
|
|
|
|
|
|
|
|
|
|
|
|
|
|
|
|
|
|
|
|
|
|
|
|
|
|
|
|
|
|
|
|
|
|
|
|
|
|
|
|
|
|
|
|
|
|
|
|
|
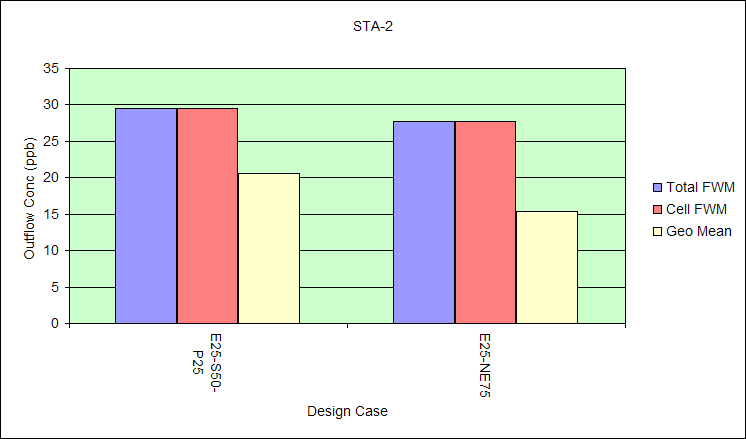
| Total FWM |
Flow-Wtd Mean Conc, Treated Flows + Bypass |
|
|
|
|
|
|
|
|
|
|
|
|
|
|
|
|
|
|
|
|
| Cell FWM |
Flow-Wtd Mean Conc, Treated Flows |
|
|
|
|
|
|
|
|
|
|
|
|
|
|
|
|
|
|
|
|
| Geo Mean |
Geometric
Mean of N-Day Flow-Weighted Means, Where N = Specified Averaging Period for
Results |
|
|
|
|
|
|
|
|
|
|
|
|
|
|
|
|
|
|
|
|
|
|
|
|
|
|
|
|
|
|
|
|
|
|
|
|
|
| File: |
test_data.xls |
|
|
|
|
|
|
|
|
|
|
|
|
|
|
|
|
|
|
|
|
|
|
Surface Area |
Mean Water Load |
Max Water Load |
Inflow Volume |
Inflow Load |
Inflow Conc |
Treated Outflow Volume |
Treated Outflow Load |
Treated FWM Outflow Conc |
Total Outflow Volume |
Total Outflow Load |
Total FWM Outflow Conc |
Bypass Volume |
Bypass Load |
Bypass Conc |
Bypass Load |
Surface Outflow Load Reduc |
Outflow Geometric Mean -
Daily |
Outflow Geo Mean - Composites |
Frequency Outflow Conc >
10 ppb |
| Case |
Description |
km2 |
cm/d |
cm/d |
hm3/yr |
kg/yr |
ppb |
hm3/yr |
kg/yr |
ppb |
hm3/yr |
kg/yr |
ppb |
hm3/yr |
kg/yr |
ppb |
% |
% |
ppb |
ppb |
% |
| E25-S50-P25 |
25% Emerg - > 50% SAV
- > 25% PSTA |
26.0 |
3.0 |
30.6 |
288.2 |
28832.1 |
100.0 |
261.9 |
7741.1 |
29.6 |
261.9 |
7742.0 |
29.6 |
0.01 |
0.97 |
74.9 |
0% |
73.1% |
21.0 |
20.6 |
100% |
| E25-NE75 |
25% Emerg - > 75% NonEmerg |
26.0 |
3.0 |
30.6 |
288.2 |
28832.1 |
100.0 |
261.9 |
7269.1 |
27.8 |
261.9 |
7270.1 |
27.8 |
0.01 |
0.97 |
74.9 |
0% |
74.8% |
16.3 |
15.4 |
68% |
|
|
|
|
|
|
|
|
|
|
|
|
|
|
|
|
|
|
|
|
|
|
|
|
|
|
|
|
|
|
|
|
|
|
|
|
|
|
|
|
|
|
|
|
|
|
|
|
|
|
|
|
|
|
|
|
|
|
|
|
|
|
|
|
|
|
|
|
|
|
|
|
|
|
|
|
|
|
|
|
|
|
|
|
|
|
|
|
|
|
|
|
|
|
|
|
|
|
|
|
|
|
|
|
|
|
|
|
|
|
|
|
|
|
|
|
|
|
|
|
|
|
|
|
|
|
|
|
|
|
|
|
|
|
|
|
|
|
|
|
|
|
|
|
|
|
|
|
|
|
|
|
|
|
|
|
|
|
|
|
|
|
|
|
|
|
|
|
|
|
|
|
|
|
|
|
|
|
|
|
|
|
|
|
|
|
|
|
|
|
|
|
|
|
|
|
|
|
|
|
|
|
|
|
|
|
|
|
|
|
|
|
|
|
|
|
|
|
|
|
|
|
|
|
|
|
|
|
|
|
|
|
|
|
|
|
|
|
|
|
|
|