| Output Tables | Dates: | 07/01/01 | thru | 11/30/02 | ||||||||
| Case: | PSTA_FSC1A | Input Series: | PSTA_FSC1 | |||||||||
| Descr: | PSTA Field Scale Cell 1, Limerock Substrate , Calib Dec 2001 - | |||||||||||
| Cell Water & Mass Balances | Case: | PSTA_FSC1A | ||||||||||
| Flow | Unit Area Flows | Total Pmass | Total P Load | Conc | Flow | |||||||
| Term | hm3 | hm3/yr | m/yr | cm/d | kg | mg/m2 | kg/yr | mg/m2-yr | ppb | % | ||
| Storage Reservoir | ||||||||||||
| Inflow | #N/A | #N/A | #N/A | |||||||||
| Outflow | #N/A | #N/A | #N/A | |||||||||
| Entire Treatment Cell | ||||||||||||
| Initial Storage | 0.00 | 6 | 316 | |||||||||
| Final Storage | 0.01 | 11 | 593 | |||||||||
| Storage Increase | 0.00 | 0.0 | 0.15 | 0.04 | 5 | 277 | 4 | 195 | ||||
| External Inflow | 0.80 | 0.6 | 29.07 | 7.96 | 22 | 1118 | 15 | 788 | 27.1 | 95% | ||
| Rainfall | 0.04 | 0.0 | 1.58 | 0.43 | 1 | 51 | 1 | 36 | 22.7 | 5% | ||
| Seepage Into Cell | 0.00 | 0.0 | 0.00 | 0.00 | 0 | 0 | 0 | 0 | 0% | |||
| Antecedent Soil Release | 0.00 | 0.0 | 0.00 | 0.00 | 0 | 0 | 0 | 0 | 0% | |||
| Total Inflow | 0.84 | 0.6 | 30.65 | 8.39 | 23 | 1169 | 16 | 824 | 26.9 | 100% | ||
| Evapotranspiration | 0.03 | 0.0 | 1.25 | 0.34 | 4% | |||||||
| Seepage Lost | 0.51 | 0.4 | 18.71 | 5.12 | 11 | 575 | 8 | 405 | 21.7 | 61% | ||
| Seepage Retained in Soil | 0.00 | 0 | 0 | 0 | 0 | 0% | ||||||
| Cell Outflow | 0.29 | 0.2 | 10.54 | 2.89 | 6 | 301 | 4 | 212 | 20.1 | 34% | ||
| Seepage Discharge | 0.00 | 0.0 | 0.00 | 0.00 | 0 | 0 | 0 | 0 | 0% | |||
| Bypass | 0.00 | 0.0 | 0.00 | 0.00 | 0 | 0 | 0 | 0 | 0% | |||
| Total Surface Outflow | 0.29 | 0.2 | 10.54 | 2.89 | 6 | 0 | 4 | 212 | 20.1 | 34% | ||
| Total Outflow | 0.84 | 0.6 | 30.50 | 8.35 | 17 | 876 | 12 | 617 | 20.2 | 100% | ||
| Burial | 0.00 | 0 | 8 | 0 | 5 | |||||||
| Mass Balance Check | 0.00 | 0 | 8 | 0 | 6 | 0% | ||||||
| Mass Balance Error | 0.0% | 0.7% | 0 | 0% | ||||||||
| Reduction % | 0.64 | 73% | 26% | |||||||||
| Water Column | ||||||||||||
| Initial Storage | 0.00 | 0 | 3 | 15.2 | 0% | |||||||
| Final Storage | 0.01 | 0 | 17 | 42.5 | 1% | |||||||
| Storage Increase | 0.00 | 0.0 | 0.15 | 0.04 | 0 | 14 | 0 | 10 | 0% | |||
| Antecedent Soil Release | 0.00 | 0.00 | 0.00 | 0.00 | 0 | 0 | 0 | 0 | 0% | |||
| Cell Inflow | 0.80 | 0.6 | 29.07 | 7.96 | 22 | 1118 | 15 | 788 | 27.1 | 95% | ||
| Seepage Recycle | 0.00 | 0.0 | 0.00 | 0.00 | 0 | 0 | 0 | 0 | 0% | |||
| Rainfall | 0.04 | 0.0 | 1.58 | 0.43 | 1 | 51 | 1 | 36 | 22.7 | 5% | ||
| Seepage In | 0.00 | 0.0 | 0.00 | 0.00 | 0 | 0 | 0 | 0 | 0% | |||
| Total Inflows | 0.84 | 0.6 | 30.65 | 8.39 | 23 | 1169 | 16 | 824 | 26.9 | 100% | ||
| ET | 0.03 | 0.0 | 1.25 | 0.34 | 0 | 4% | ||||||
| Seepage Out | 0.51 | 0.4 | 18.71 | 5.12 | 11 | 575 | 8 | 405 | 21.7 | 61% | ||
| Cell Outflow | 0.29 | 0.2 | 10.54 | 2.89 | 6 | 301 | 4 | 212 | 20.1 | 34% | ||
| Total Outflows | 0.84 | 0.6 | 30.50 | 8.35 | 17 | 876 | 12 | 617 | 20.2 | 100% | ||
| Direct Sedimentation | 0 | 0 | 0 | 0 | ||||||||
| Storage Uptake | 7 | 343 | 5 | 242 | ||||||||
| Recycle from Storage | 1 | 73 | 1 | 51 | ||||||||
| Recycle from Soil | 0 | 0 | 0 | 0 | ||||||||
| Net Removal | 5 | 270 | 4 | 191 | ||||||||
| Mass Balance Check | 0.00 | 0.0 | 0 | 8 | 0 | 6 | ||||||
| Mass Balance Error | 0.0% | 0.7% | ||||||||||
| Reduction % | 64% | 73% | 26% | |||||||||
| Biomass P Storage | ||||||||||||
| Initial Storage | 3 | 153 | ||||||||||
| Final Storage | 7 | 355 | ||||||||||
| Storage Increase | 4 | 202 | 3 | 143 | ||||||||
| Uptake | 7 | 343 | 5 | 242 | ||||||||
| Recycle | 1 | 73 | 1 | 51 | ||||||||
| Deposition | 1 | 68 | 1 | 48 | ||||||||
| Mass Balance Check | 0 | 0 | ||||||||||
| Mass Balance Error | 0.0% | |||||||||||
| Soil P Storage | ||||||||||||
| Initial Storage | 3 | 160 | ||||||||||
| Final Storage | 4 | 220 | ||||||||||
| Storage Increase | 1 | 60 | 1 | 43 | ||||||||
| Biomass Deposition | 1 | 68 | 1 | 48 | ||||||||
| Direct Deposition | 0 | 0 | 0 | 0 | ||||||||
| Soil P Release | 0 | 0 | 0 | 0 | ||||||||
| Burial | 0 | 8 | 0 | 5 | ||||||||
| Mass Balance Check | 0 | 0 | ||||||||||
| Mass Balance Error | 0.0% | |||||||||||
| Frequency Distributions | Case: | PSTA_FSC1A | ||||||||||
 
|
||||||||||||
| Daily Values | Inflow | Inflow | Outflow | Outflow | Outflow | Wet | ||||||
| Cumul. | Inflow | Conc | Load | Bypass | Outflow | Load | Conc | Conc * | Depth | Area | ||
| Percent | hm3/d | ppb | kg/d | hm3/d | hm3/d | kg/d | ppb | ppb | m | % | ||
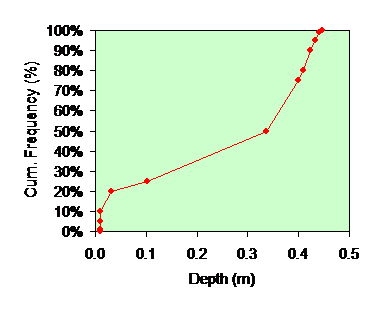
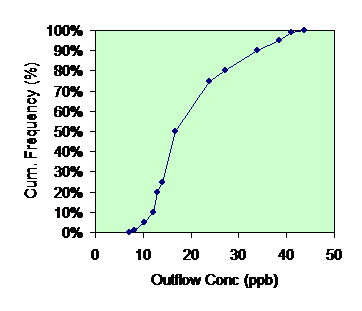
| 0% | 0.00 | 9.0 | 0.0 | 0.0 | 0.00 | 0.0 | 4.5 | 7.1 | 0.01 | 1.00 | ||
| 1% | 0.00 | 10.2 | 0.0 | 0.0 | 0.00 | 0.0 | 5.5 | 8.1 | 0.01 | 1.00 | ||
| 5% | 0.00 | 11.5 | 0.0 | 0.0 | 0.00 | 0.0 | 6.3 | 10.3 | 0.01 | 1.00 | ||
| 10% | 0.00 | 14.1 | 0.0 | 0.0 | 0.00 | 0.0 | 6.7 | 12.1 | 0.01 | 1.00 | ||
| 20% | 0.00 | 15.4 | 0.0 | 0.0 | 0.00 | 0.0 | 7.7 | 13.0 | 0.03 | 1.00 | ||
| 25% | 0.00 | 16.1 | 0.0 | 0.0 | 0.00 | 0.0 | 8.5 | 14.0 | 0.10 | 1.00 | ||
| 50% | 0.00 | 21.0 | 0.0 | 0.0 | 0.00 | 0.0 | 13.0 | 16.7 | 0.34 | 1.00 | ||
| 75% | 0.00 | 35.0 | 0.1 | 0.0 | 0.00 | 0.0 | 18.3 | 23.9 | 0.40 | 1.00 | ||
| 80% | 0.00 | 38.4 | 0.1 | 0.0 | 0.00 | 0.0 | 20.6 | 27.1 | 0.41 | 1.00 | ||
| 90% | 0.00 | 53.0 | 0.1 | 0.0 | 0.00 | 0.0 | 30.4 | 34.0 | 0.42 | 1.00 | ||
| 95% | 0.00 | 64.0 | 0.1 | 0.0 | 0.00 | 0.0 | 36.1 | 38.5 | 0.43 | 1.00 | ||
| 99% | 0.00 | 64.0 | 0.2 | 0.0 | 0.00 | 0.0 | 40.4 | 41.1 | 0.44 | 1.00 | ||
| 100% | 0.00 | 75.0 | 0.2 | 0.0 | 0.00 | 0.1 | 43.8 | 43.8 | 0.45 | 1.00 | ||
| Mean | 0.00 | 27.5 | 0.0 | 0.0 | 0.00 | 0.0 | 15.5 | 20.0 | 0.26 | 1.00 | ||
| StdDev | 0.00 | 15.2 | 0.0 | 0.0 | 0.00 | 0.0 | 9.0 | 8.6 | 0.16 | 0.00 | ||
| CV | 0.66 | 0.55 | 0.92 | 0.97 | 1.11 | 0.58 | 0.43 | 0.60 | ||||
| Q-WtdMn | 27.1 | 20.1 | 20.1 | |||||||||
| * Conc on Days with Flow > | 0.01 | & Depth > | 1 | m | ||||||||