|
E P G MEverglades Phosphorus Gradient ModelVersion 1.0prepared forU.S. Department of the InteriorbyWilliam W. Walker, Jr., Environmental EngineerandRobert H. Kadlec, Wetland Management ServicesAugust 1996 |
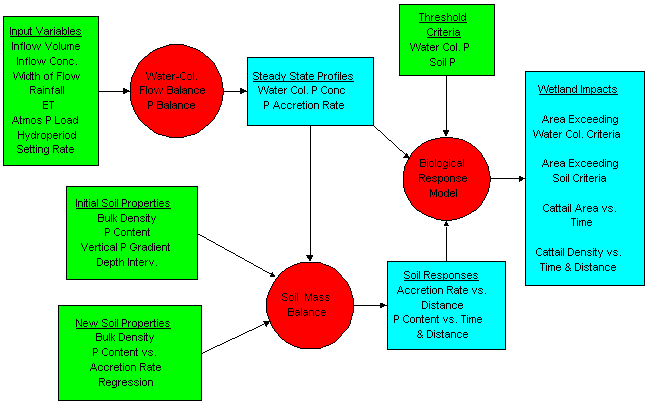
References:Walker, W.W. & R.H. Kadlec, "A Model for Simulating Phosphorus Concentrations in Waters and Soils Downstream of Everglades Stormwater Treatment Areas", prepared for U.S. Department of Interior, Draft, August 13, 1996. Download (17 mb): Part 1 Part 2. Kadlec, R.H. & W.W. Walker, "Management Models to Evaluate Phosphorus Impacts on Wetlands", Phosphorus Biogeochemistry in Subtropical Ecosystems, K.R. Reddy, G.A. O'Connor, & C.L. Schelske, eds., Lewis Publishers, pp. 621-642, 1999.Modeling Phosphorus Dynamics in Everglades Wetlands and Stormwater Treatment Areas, presented at GEER 2008: Greater Everglades Ecosystem Restoration Conference, Naples, Florida, July 31, 2008 (with R. Kadlec). Abstract:The model used for Stormwater Treatment Area (STA) design is expanded to include mass balances on marsh water-columns and surface soils. EPGM (Everglades Phosphorus Gradient Model, Figure 1) predicts variations in water-column P concentration, peat accretion rate, and soil P concentration along a horizontal gradient imposed by an external phosphorus load and sheet-flow conditions. Potential biological responses are expressed in terms of marsh surface area exceeding threshold criteria for water-column and soil phosphorus concentrations. Areas exceeding water-column P criteria are surrogates for impacts on ecosystem components which respond primarily to variations in water-column concentration (e.g., periphyton, algae). Cattail densities and total areas are predicted based upon correlations with soil phosphorus and are surrogates for impacts on ecosystem components which respond to soil P variations in similar concentration ranges. EPGM is calibrated to soil and vegetation data from WCA-2 (primarily), WCA-1, and WCA-3A. The model successfully simulates observed longitudinal gradients in soil P concentration below the S10 structures in WCA-2A after ~28 years of external P loading (1962 to 1990). Observed expansion of cattail populations in this region between 1973 and 1991 is also simulated, though somewhat over-predicted during the first 20 years. Model results suggest a linear relationship between marsh water-column and soil P concentrations over long time scales. Times required for soil P levels to reach steady-state following a change in average water-column concentration to 50 ppb are derived by mass balance . Estimated soil response times range from 20 to 40 years, depending on soil depth, and are inversely related to water-column concentration. The model is applied to quantify the phosphorus-related impacts of routing 50 ppb STA discharges through flow-distribution structures designed to improve hydropattern and hydroperiod in the northern Everglades. Impacts likely to occur within 4-8 years after start of discharge (the expected maximum duration of 50 ppb concentrations) are evaluated. Simulations are performed for average hydrologic conditions. Water-column impact areas range from 135 to 12,000 hectares, depending upon STA and P threshold criterion (10 - 30 ppb). Soil impact areas range from 0 to 1755 hectares and predicted increases in cattail area range from 9 to 236 hectares, depending upon STA, threshold criterion (540 - 990 mg/kg), and simulated soil depth (0-10, 0-20 cm). Because of differences in initial soil conditions, predicted rates of soil P increase and cattail growth below STA-s 34, 5, and 6 are much lower than predicted rates below STA-2. Simulations indicate that if the 50 ppb discharges were to continue over longer time frames (> 20-40 years), soil impact areas would be similar in scale to water-column impact areas. The distinction is made between gross impacts and net impacts of discharging through the flow distribution structures. Discharging to other locations would displace phosphorus impacts of similar magnitude to other locations. Other factors to be considered in evaluating discharge alternatives include (1) differences in existing wetland characteristics; (2) relative impacts of alternatives on transport of phosphorus loads to Loxahatchee National Wildlife and Everglades National Park; (3) impacts of additional phosphorus loads occurring as a result of delays in STA construction if alternative discharge locations were selected; and (4) possible reversibility of biological impacts caused by increases in water-column P (vs. Soil P). Overall, the project is expected to provide substantial reductions in wetland areas exceeding P threshold criteria for soil and water as a result of the substantial (~80%) decrease in P load. The sensitivity of predictions to input variables (coefficients, initial conditions, driving variables) is explored using several techniques. Considering its structure, calibration, and sensitivities, EPGM is most reliable for predicting long-term-average water-column and soil P levels. Measured initial soil conditions have a strong influence on predicted soil P and cattail responses within a 4-8 year time frame. Refinements to the model structure are needed improve model performance over short time scales in response to variations in hydrology (flow, hydroperiod, drought), P loading, biomass P storage, and STA startup phenomena. EPGM Structure
Lotus 123 Version - August 1996; File EPGM.ZIP (Size = 390 Kb) Contains Spreadsheet File EPGM.WK4. Excel Version - September 2004: Return to W.W.Walker Home Page
http://www.wwwalker.net/epgm
|
|

