|
STA & Reservoir Performance Measures for the Everglades RestudyResults for Water Years 1979-198803/30/02 |
|
STA & Reservoir Performance Measures for the Everglades RestudyResults for Water Years 1979-198803/30/02 |
This page summarizes water and mass-balance results for Water Years 1979-1988 (October 1978 - September 1988). This period has been used in designing Stormwater Treatment Areas under the Everglades Construction Project and in developing interim treatment targets under the Settlement Agreement and Everglades Forever Act. Results assume that Best Management Practices in the Everglades Agricultural Area achieve a 25% reduction in phosphorus loads, relative to loads measured in 1979-1988.
Figures & Discussion:
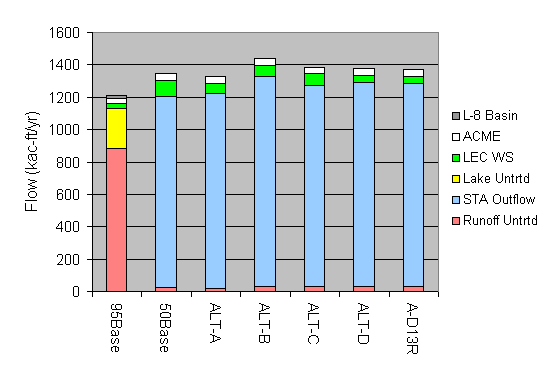
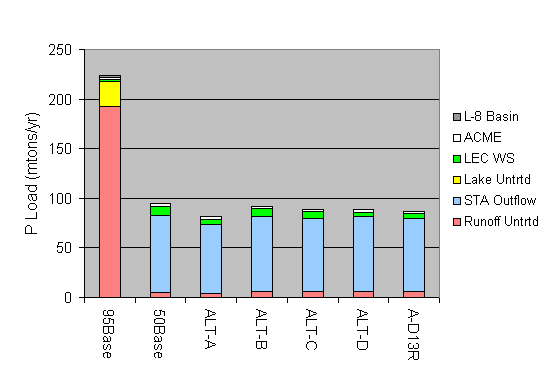
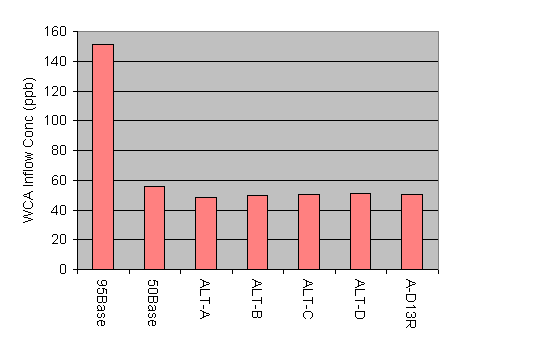
| WCA Inflows , Water Years 1979-1988 |
|
|
|
| These charts summarize average WCA inflows for Water Years 1979-1988. Source categories include untreated runoff, STA outflows, untreated lake releases, LEC water supply delivered through WCA's, and other (* inflows from L8 and Acme Drainage District not routed through STA's). |
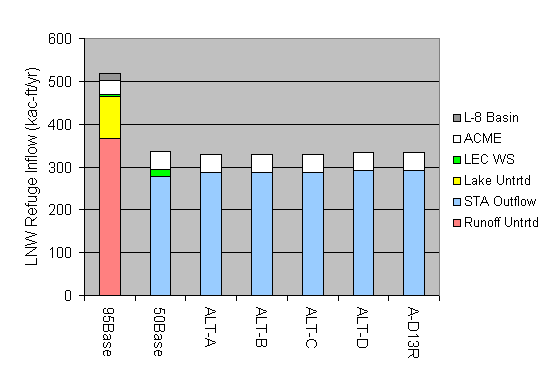
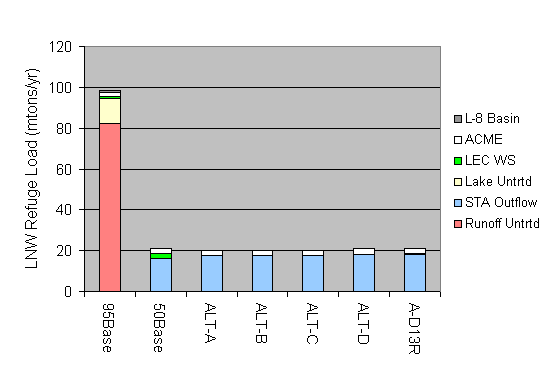
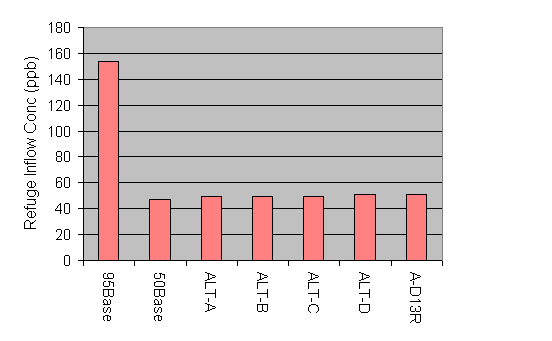
| Loxahatchee National Wildlife Refuge Inflows , WY 1979-1988 |
|
|
|
| These charts summarize average inflows to ARM Loxahatchee National Wildlife Refuge for Water Years 1979-1988. Source categories include untreated runoff, STA outflows, untreated lake releases, LEC water supply delivered through WCA's, and other (* inflows from L8 and Acme Drainage District not routed through STA's). |
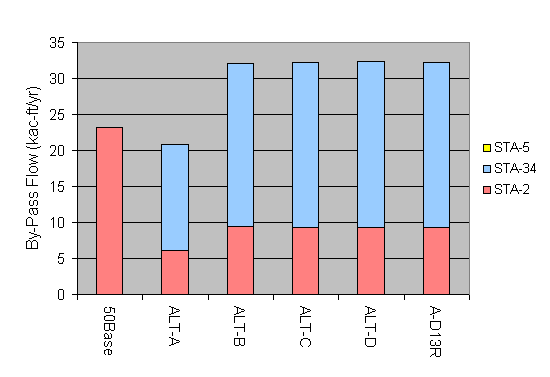
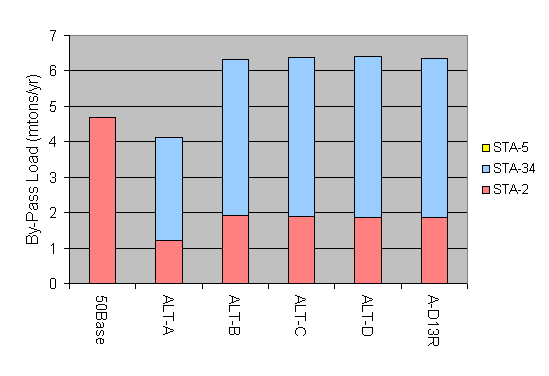
| STA High-Flow Bypasses , Water Years 1979-1988 |
|
|
| These charts show average bypassed flows and loads for each alternative and STA in Water Years 1979-1988. The STA design basis under the Everglades Forever Act calls for no bypasses during this period. |
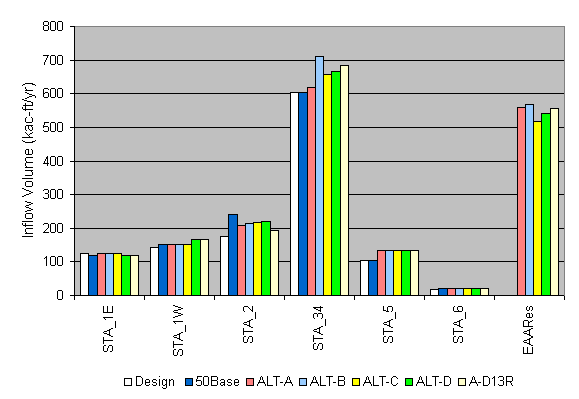
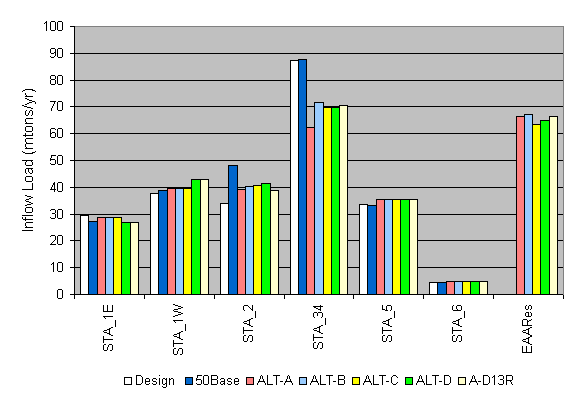
| STA Inflows, Water Years 1979-1988 |
|
|
|
| These charts show flows, loads, & concentrations in the combined inflows to the STA's & EAA Reservoirs for Water Years 1979-1988. Results for each alternative are compared with the STA conceptual design for Water Years 1979-1988. The combined inflow to each STA consists of the treatment area inflow plus high-flow bypass. |
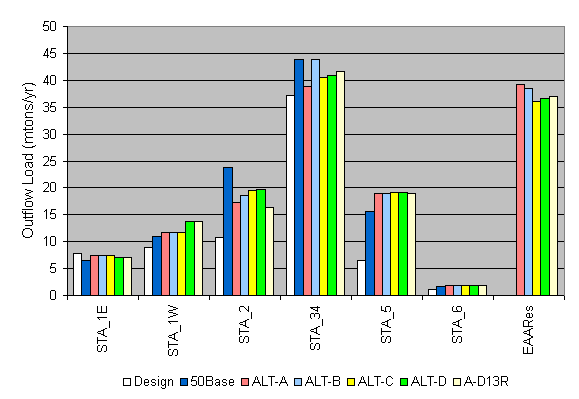
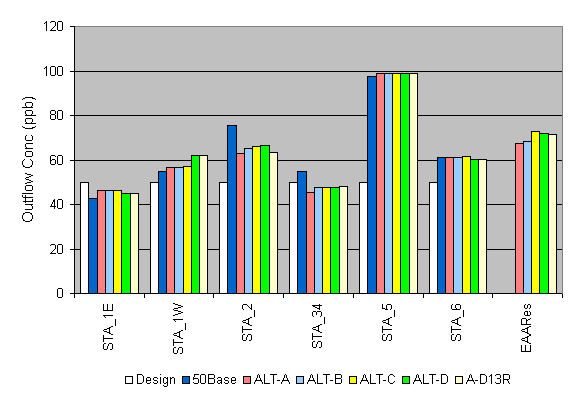
| STA Outflows, Water Years 1979-1988 |
|
|
|
| These charts show flows, loads, & concentrations in the combined outflows from the STA's (= inflows to Water Conservation Areas) for Water Years 1979-1988. Results for each alternative are compared with the STA conceptual design for the same period. The combined outflow from each STA consists of the treatment area outflow plus high-flow bypass. |
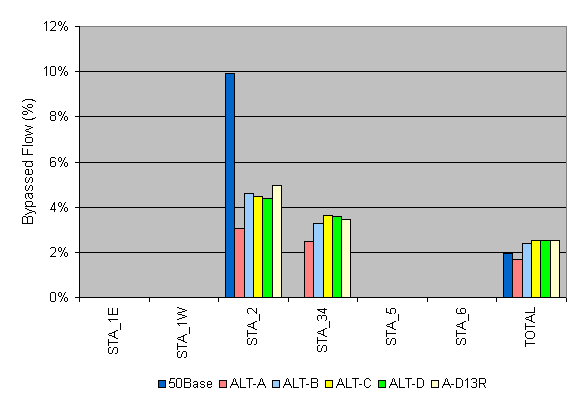
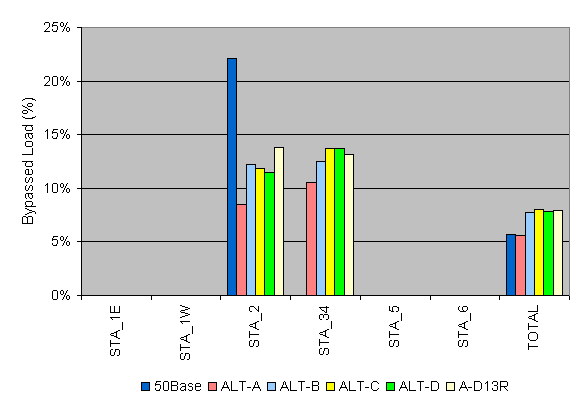
| STA High-Flow Bypasses, Water Years 1979-1988 |
|
|
| These charts show high-flow bypass flow & load for Water Years 1979-1988 as percentages of the combined discharge from each STA. The combined discharge consists of the STA outflow plus high-flow bypass. STA conceptual designs require treatment of all flows during this period (no high-flow bypass). |
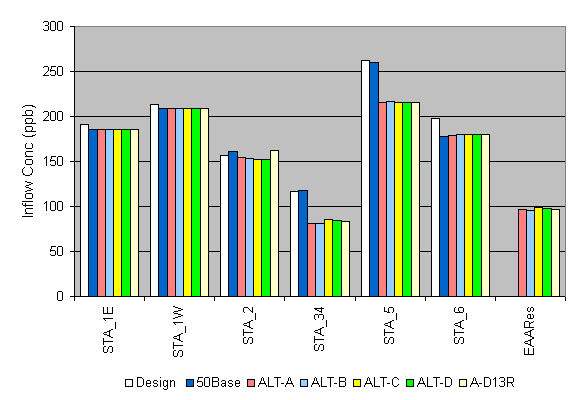
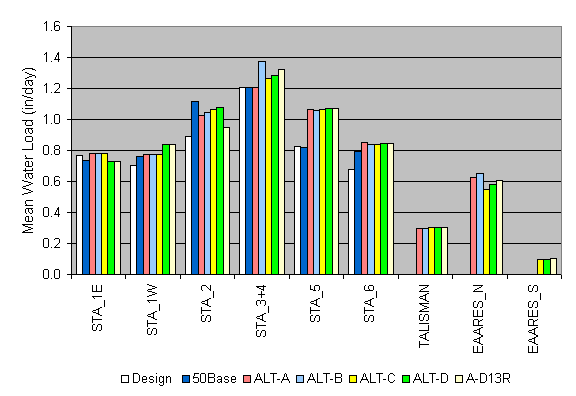
Mean Water Loads, Water Years 1979-1988 |
|
| This chart compares average the inflow water load with the design value for each STA under 1979-1988 hydrologic conditions. The 1979-1988 period was used as a design basis for the STA's. Other factors being equal, higher water loads will result in lower phosphorus retention efficiencies and higher outflow concentrations. Water loads exceeding design values are likely to result in outflow concentrations exceeding the design target of 50 ppb. |
STA & Reservoir Performance Measures
http://www.wwwalker.net/restudy/all7988.htm Updated: 03/30/02