|
STA & Reservoir Performance Measures for the Everglades RestudyComparisons of ECP with Restudy Alternatives03/30/02 |
||||||||||||||||||||||||||||||||||||||||||||||||||||||||||||||||||||||||||||||||||||||||||||||||||||||||||||||||||||||||||||||||||||||||||||||||||||||||||||||||||||||||||||
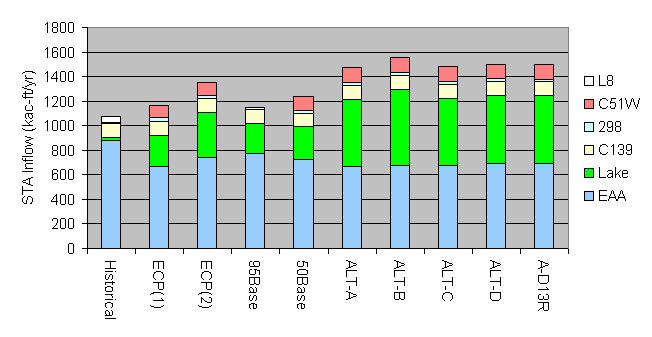
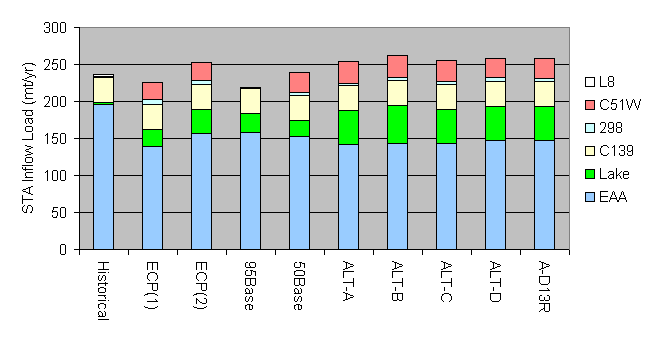
This page presents comparisons of STA/reservoir
mass balances between the ECP design and Restudy alternatives. ECP design values are
given for three conditions:
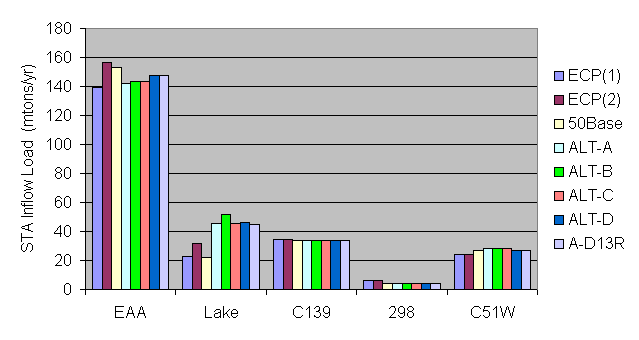
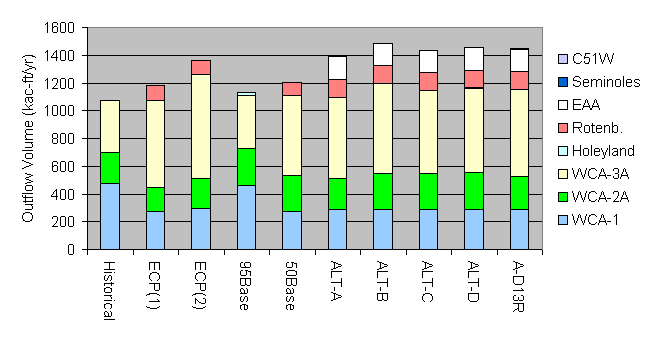
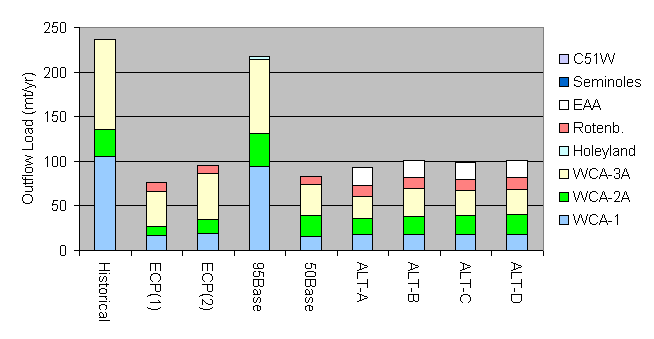
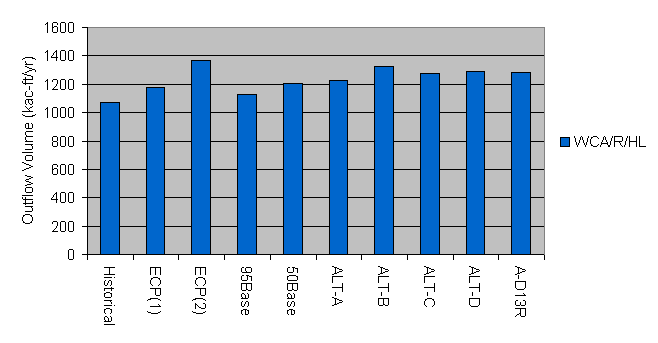
Restudy values are given for the 2050 base condition (50Base) and each alternative (ALT-A,B,C,D,D13R). Sources which are not treated by the ECP (urban water supply deliveries, discharges from Acme Drainage District) are not considered in these comparisons. Detailed results by STA are given in attached tables for each design period (1965-1995, WY 1979-1988) and each BMP performance assumption (25%, 51%). Another set of tables summarizes total project inflows by source (EAA runoff, lake release, etc.) and total project outflows by location (WCA-1, WCA-2A, etc..) for each design period and BMP assumption. Differences in the predicted STA outflow volumes between the ECP design and Restudy alternatives can be partially attributed to differences in the areal water budget terms for the STA's (rainfall, evapotranspiration, and seepage). The following table compares ECP design with 50Base values (area-weighted mean over all STAs) for Water Years 1979-1988:
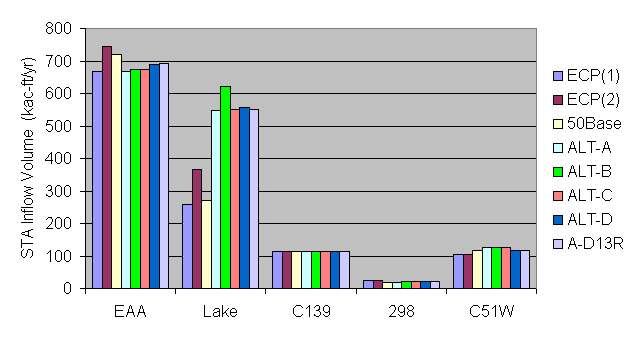
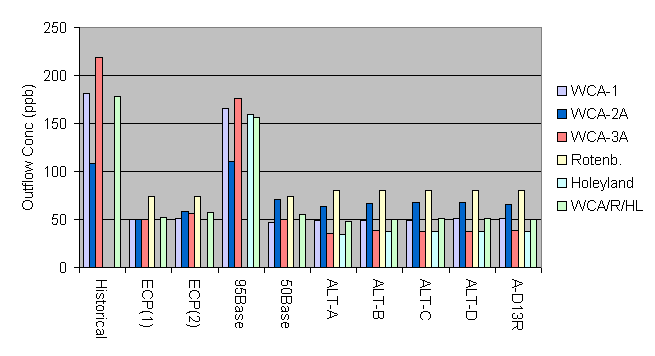
Higher evapotranspiration rates in the Restudy simulations (57.2 vs. 45.3 in/yr)are primarily responsible for differences in the net water budget terms. Applied over the 39,918-acre total STA surface area, the net areal flow difference of -13.5 inches/year amounts to a net flow difference of -44.5 kac-ft/yr. This means that for the same inflow volumes, the Restudy assumptions (inherent in the SFWMM) would predict 44.5 kac-ft/yr less outflow, as compared ECP assumptions. This difference amounts to ~4% of the historical inflow to the WCA's (1075 kac-ft/yr), which was used as a basis for calculating the 28% flow increase required by the Everglades Forever Act. Thus, if the EFA target were adjusted to account for differences in areal fluxes (principally, ET), the target would be 24% instead of 28%. Actual ET rates may fall somewhere between the ECP (45.3 in/yr) and 50Base (57.2 in/yr) values. Measured ET rates in the Everglades Nutrient Removal Project were 47.5 in/yr (Dec 1, 1995 - Nov 30, 1996) and 49.6 in/yr (Dec 1, 1996 - Nov 30, 1997) (SFWMD, Everglades Nutrient Removal Project 1996 and 1997 Monitoring Reports). The following table compares ECP design with 50Base values for STA inflow volumes over Water Years 1979-1988:
* Percent Increase relative to historical WCA inflow of 1075 kac-ft/yr. The volume of C51W runoff captured under the 50Base run (117.4 kac-ft/yr) is 11% higher than that captured under the ECP plans (105.4 kac-ft/yr). Otherwise, differences in lake release and net areal fluxes account for most of the differences between the ECP designs and the 50Base run. The ECP design and Restudy runs also differ with respect to STA bypass predictions. The ECP design treats all EAA runoff in the WY 1979-1988 period. Predicted bypass volumes for the 50Base run and each Restudy alternative are summarized below:
The following table compares bypass volumes for the 1965-1995 period:
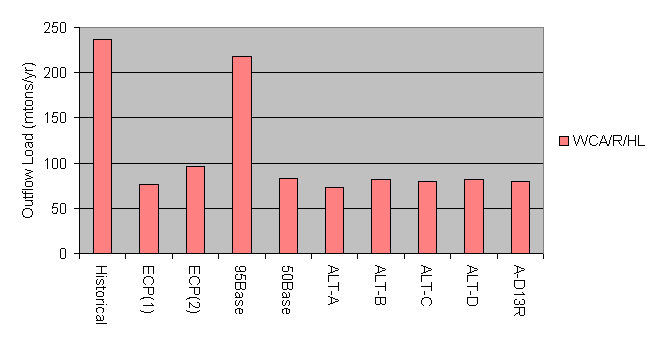
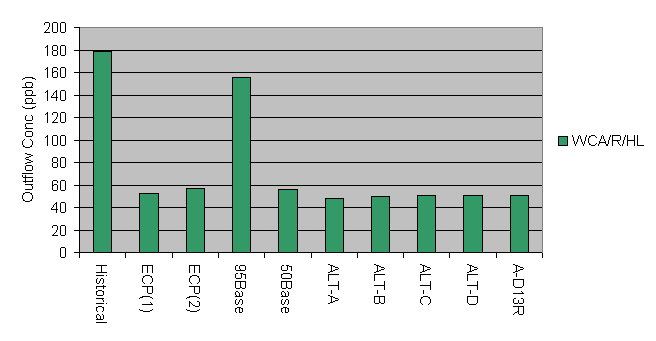
As distinguished from the ECP design, the Restudy alternatives predict frequent bypass events for STA-2 during the WY 1979-1988 period. Under the 50Base run, it is possible that these bypasses reflect peak flows which were historically backpumped to Lake Okeechobee and were not considered in the ECP design. With the Restudy Alternatives, STA-2 bypass volumes decrease while STA-34 bypass volumes increase. The mass-balance comparisions indicate that IAP flows would have a larger impact in total inflows to STA-2 and STA-34 than on inflows to other STA's (compare ECP(1) vs. ECP(2) inflows). Further investigation of the SFWMM simulation algorithm for STA's is needed to determine whether STA bypass volumes predicted by the SFWMM should be a real concern from a design perspective. All Restudy runs assume that the second portion of STA-6 is not constructed and that runoff from the C-139 Annex is not treated in the ECP. Although there is a possiblity that the second unit will not be constructed (depending upon observed performance of STA-5 and the first portion of STA-6), current plans call for construction of both units. If this occurs, a portion of the runoff from C-139 will be treated in STA-6 and the overloading of STA-5 predicted for all restudy alternatives will be alleviated to some extent. Figures & Discussion (Water Year 1979-1988, BMP Performance = 25%):
|
|||||||||||||||||||||||||||||||||||||||||||||||||||||||||||||||||||||||||||||||||||||||||||||||||||||||||||||||||||||||||||||||||||||||||||||||||||||||||||||||||||||||||||||