|
STA & Reservoir Performance Measures for the Everglades RestudyKey Performance Indicators03/04/05 |
|
STA & Reservoir Performance Measures for the Everglades RestudyKey Performance Indicators03/04/05 |
| This page summarizes indicators of STA & Reservoir
performance that could be used along with other hydrologic
indicators in ranking Restudy alternatives. Performance Indicators (PI's) are listed in attached tables. Each matrix contains values for 24 potential PI's and 5 Alternatives (50Base, ALT-A, ALT-B, ALT-C, ALT-D, & ALT-D13R). A separate PI matrix is supplied for each BMP performance assumption:
Performance indicators are grouped in four general categories:
Values in the first three groups are based upon the entire simulation period for the Restudy (1965-1995). Values in the last group are based upon Water Years 1979-1988, which was used for setting interim treatment goals under the Settlement Agreement and Everglades Forever Act. The methodology used for ranking alternatives follows that suggested by Eric Bush of FDEP (e-mail to Restudy Water Quality group, May 13, 1998). For each performance indicator, alternatives are ranked on a scale of 1 (worst) to 6 (best). Composite rankings are developed within each category based upon a weighted average of ranks for each PI. Weighted ranks are rescaled to a range of 1 to 10. Each PI is assigned a weighting factor (>=0). Weighting factors should be determined by group consensus. Default values (1) are assumed for all but two PI's in this preliminary evaluation. The two exceptions are outflow concentrations from STA-6; these are not influenced significantly by any of the Restudy alternatives. An Excel workbook containing PI matrices and ranking methodologies is attached. This workbook can be used by Restudy Water Quality Group members to test alternative weighting schemes. No doubt there is room for simplification and consolidation of the PI's. A PI can be eliminated from the ranking scheme by setting its weighting factor to 0. Generally, differences among restudy alternatives based upon these criteria are relatively small. Preliminary weighted scores (scale of 1-10) for each alternative and category using the 25% BMP performance assumption are summarized below:
Rankings with the 51% BMP performance assumption are similar. The ranking scheme is not totally satisfactory because it does not reflect the fact that differences among alternatives are very small for many PI's. For example, the range of 1965-1995 WCA inflow concentrations for Alternatives ABCDD13R is 55 to 58 ppb. The range of 1965-1995 total load reductions is 167 to 169 mt/yr. Greater differences are observed for other indicators (e.g., range of STA Bypass Loads = 4.9 to 7.1 mt/yr). It may be appropriate to eliminate redundancy by eliminating some PI's or by adjusting weighting factors. Although the differences in PI values are relatively small, the high ranking of Alt-A reflects the following factors:
Click here to view Performance Indicator Values & Rankings of Alternatives Click here to download Excel Workbook for Ranking Alternatives Selected Charts & Discussion (attached to this page): Phosphorus Concentration Criteria:
Phosphorus Load Criteria:
Hydrologic Criteria: Settlement Agreement & Everglades Forever Act Targets: |
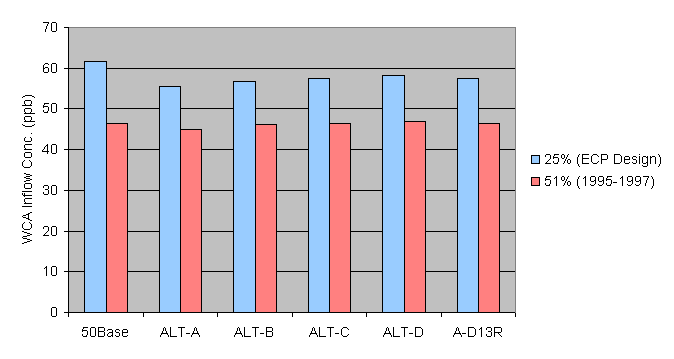
| WCA Inflow P Concentrations |
|
| This chart shows flow-weighted-mean concentrations in the combined inflows to the Water Conservation Areas for 1965-1995 and for two BMP performance assumptions (25% & 51%). Results exclude urban water-supply deliveries. |
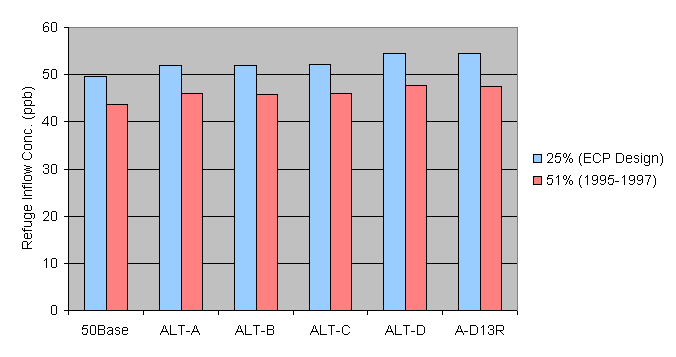
| Refuge Inflow P Concentrations |
|
| This chart shows flow-weighted-mean concentrations in the combined inflows to the Loxahatchee National Wildlife Refuge for 1965-1995 and for two BMP performance assumptions (25% & 51%). Results exclude urban water-supply deliveries. |
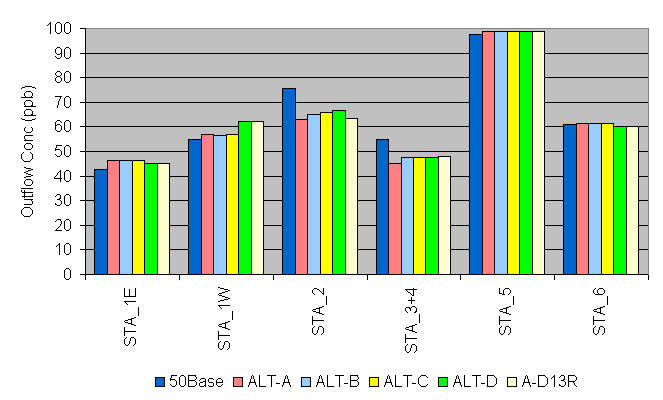
| STA Outflow P Concentrations, 25% BMP Reduction |
|
| This chart shows the flow-weighted-mean concentration in the combined discharge from each STA for 1965-1995. Results assume a BMP load reduction of 25% (ECP Design Basis). The combined discharge consists of the treatment area outflow plus bypasses (excluding urban water-supply deliveries). |
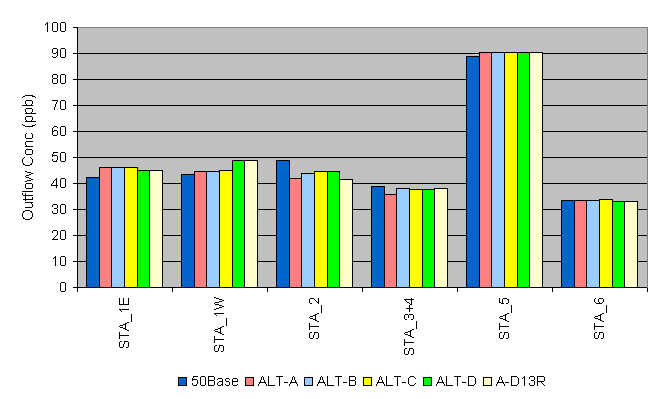
| STA Outflow P Concentrations, 51% BMP Reduction |
|
| This chart shows the flow-weighted-mean concentration in the combined discharge from each STA for 1965-1995. Results assume a BMP load reduction of 51% (1995-1997 average). The combined discharge consists of the treatment area outflow plus bypasses (excluding urban water-supply deliveries). |
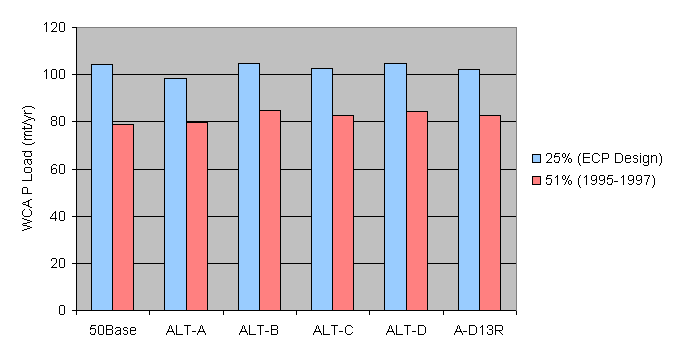
| WCA Phosphorus Loads |
|
| This chart shows average annual total phosphorus loads to the Water Conservation Areas for 1965-1995 and for two BMP performance assumptions (25% & 51%). Results exclude urban water-supply deliveries. |
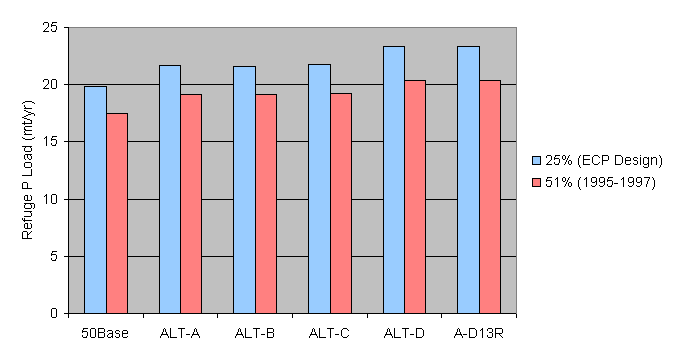
| Refuge Phosphorus Loads |
|
| This chart shows average annual total phosphorus loads to the Loxahatchee National Wildlife Refuge for 1965-1995 and for two BMP performance assumptions (25% & 51%). Results exclude urban water-supply deliveries. |
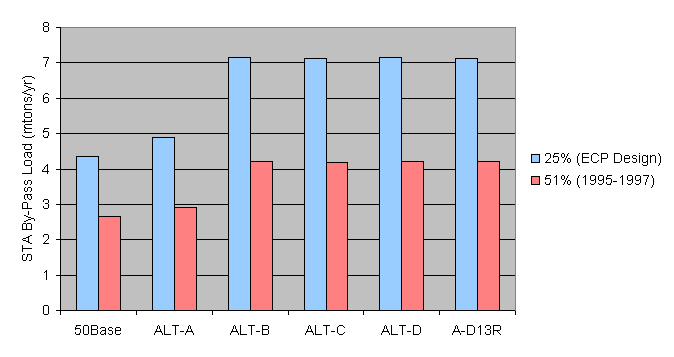
| STA Bypass Loads |
|
| This chart shows average annual STA bypass loads for 1965-1995 and for two BMP performance assumptions (25% & 51%). Bypass occurs when basin outflow (required for flood control) exceeds STA hydraulic capacity. Click here to view bypass volumes & loads for each STA & 25% BMP performance assumption. |
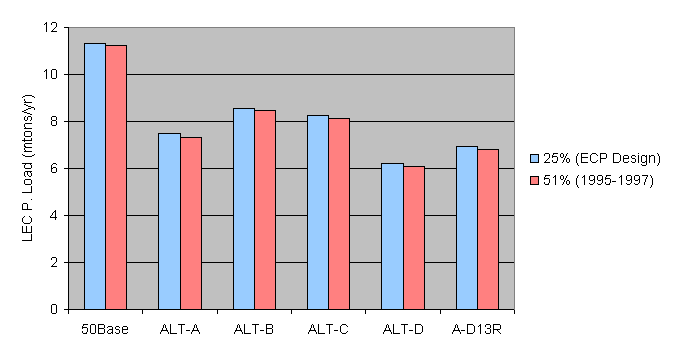
| Urban Water Supply P Loads |
|
| This chart shows the total load associated with LEC urban water supply flows delivered through the Water Conservation Areas and bypassing treatment facilities. Results are shown for BMP performance assumptions of 25% (ECP Design Basis) and 51% (1995-1997 average). Although water supply deliveries are generally made during dry periods when there is little interaction between canal flows and adjacent WCA marshes, lower loads are desirable for minimizing marsh exposure to untreated canal flows. |
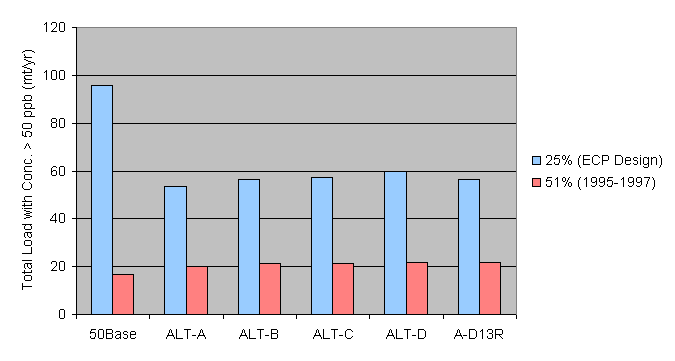
| Load with Phosphorus Conc. > 50 ppb |
|
| This chart shows the sum of phosphorus loads for WCA inflow components with 1965-1995 flow-weighted-mean phosphorus concentrations exceeding 50 ppb. Urban water supply flows are excluded. Results are shown for BMP performance assumptions of 25% (ECP Design Basis) and 51% (1995-1997 average). |
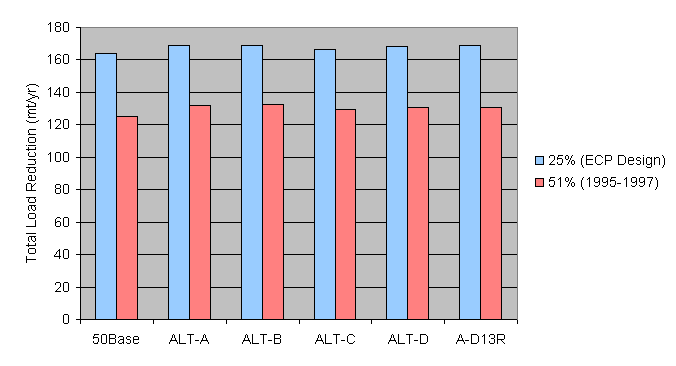
| Total Load Reductions |
|
| This chart shows the total load reduction for all STA's and EAA reservoirs, based upon the difference between the average inflow and outflow loads from each facility in 1965-1995. Results are shown for BMP performance assumptions of 25% (ECP Design Basis) and 51% (1995-1997 average). Click here to view load reductions by STA for 25% BMP performance assumption. Click here to view load reduction components. |
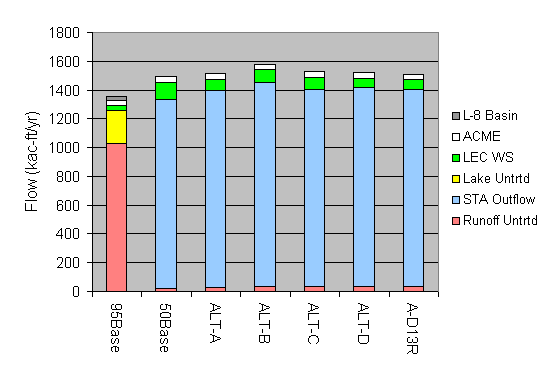
| WCA Inflow Volumes |
|
| This chart shows the average combined inflow volumes to the Water Conservation Areas for 1965-1995. "Other" includes inflows to WCA-1 from ACME Drainage District and southern L-8 basin. |
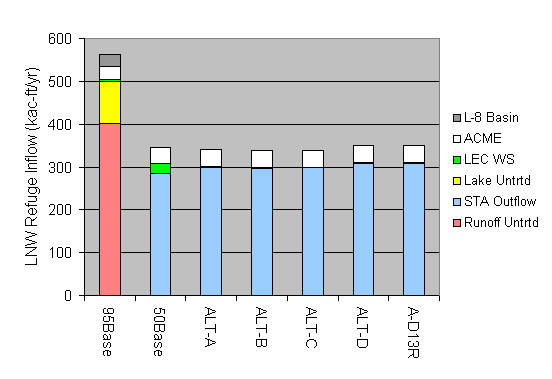
| Refuge Inflow Volumes |
|
| This chart shows the average combined inflow volumes to the Loxahatchee National Wildlife Refuge for 1965-1995. "Other" includes inflows from ACME Drainage District and southern L-8 basin. |
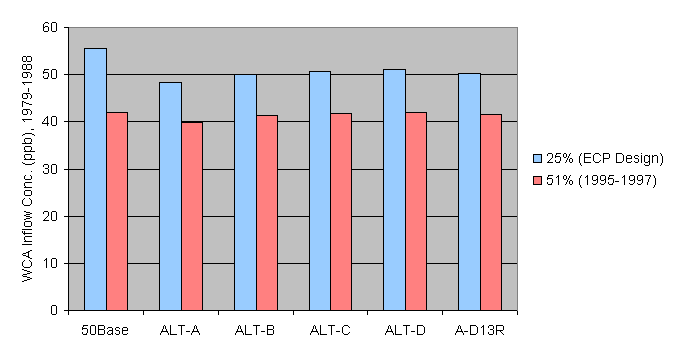
| WCA Inflow P Concentrations, 1979-1988 |
|
| This chart shows flow-weighted-mean total phosphorus concentrations in the combined inflows to the Water Conservation's Areas for Water Years 1979-1988 and for two BMP performance assumptions (25% & 51%). Results exclude urban water-supply deliveries. Phosphorus concentrations <= 50 ppb would be consistent with interim treatment goals established in the Settlement Agreement and Everglades Forever Act. This 10-year period was used as a hydrologic basis for designing the Stormwater Treatment Areas. |
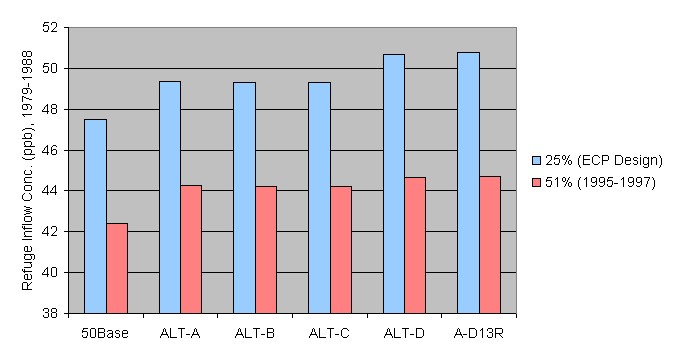
| Refuge Inflow P Concentrations,1979-1988 |
|
| .This chart shows flow-weighted-mean total phosphorus concentrations in the combined inflows to the Loxahatchee National Wildlife Refuge for Water Years 1979-1988 and for two BMP performance assumptions (25% & 51%). Results exclude urban water-supply deliveries. Phosphorus concentrations <= 50 ppb would be consistent with interim treatment goals established in the Settlement Agreement and Everglades Forever Act. This 10-year period was used as a hydrologic basis for designing the Stormwater Treatment Areas. |
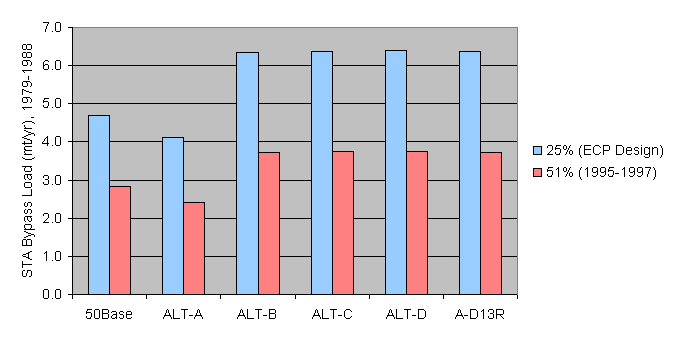
| STA Bypass Loads, 1979-1988 |
|
| This chart shows average annual STA bypass loads for Water Years 1979-1988 and for two BMP performance assumptions (25% & 51%). Bypass occurs when basin outflow (required for flood control) exceeds STA hydraulic capacity. This 10-year period was used as a hydrologic basis for designing the Stormwater Treatment Areas. Both the Everglades Forever Act and Settlement Agreement require that treatment facilities be sized to treat all flows during this period(excluding urban water-supply deliveries) without hydraulic bypass. |
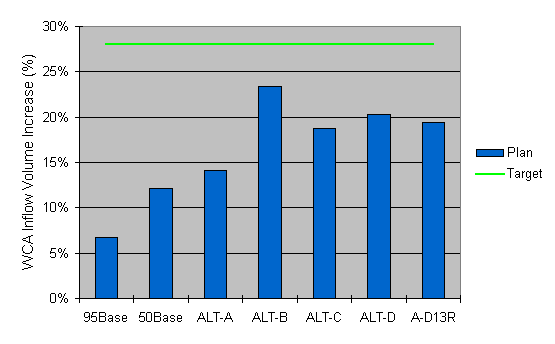
| Flow Increase to WCA's vs. WY 1979-1988 |
|
| This chart shows the percent increase in total inflow to the Water Conservation Areas for Water Years 1979-1988. The increase is expressed as a percent of the historical inflow volume (1075 kac-ft/yr). Values exclude urban water-supply deliveries. The Everglades Forever Act calls for a 28% increase in flow. |
STA & Reservoir Performance Measures
http://www.wwwalker.net/restudy/key.htm Updated: 03/04/05