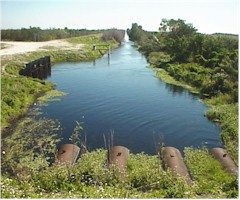
L-4 Canal looking East from G88

STA & Reservoir Performance Measures for the Everglades Restudy

Sensitivity Analysis

03/30/02

Site Index

This page shows the sensitivity of predicted STA performance to the assumed rate of phosphorus uptake in the Stormwater Treatment Areas for the 2050 Base Run and Restudy Alternative D13R.   The STA design model assumes that phosphorus removal per unit area is proportional to the long-term-average water-column concentration along the gradient between the inflow and outflow of the treatment area.  Removal rates are embodied in the assumed  "settling rate" parameter (units = m/yr).  Predicted outflow concentrations are given for 5 assumed settling rates:
  • 10.2 m/yr, STA Design Basis (Walker, 1995), estimated from WCA-2A peat accretion over a 26-year period.
  • 8 m/yr, demonstrates sensitivity to lower rates; compared with 8.9 m/yr (lower end of 90% confidence interval for STA design value)
  • 12 m/yr, demonstrates sensitivity to higher rates; compared with 11.6 m/yr (upper end of 90% confidence interval for STA design value); compared with 12.1 m/yr, estimated from WCA-2A water column phosphorus data from periods when the marsh was continuously flooded (Walker, 1995).
  • 15 & 20 m/yr,  values typical of the Everglades Nutrient Removal Project (ENRP) since startup in August 1994; may exceed long-term sustainable rates because of startup phenomena and lower peak hydraulic loads to the ENRP, as compared with full-scale STA'ss.

For each assumed settling rate and STA, the following items are tabulated:

  • Predicted Outflow Concentrations with ECP Treatment Areas (originally sized to achieve 50 ppb).
  • Treatment Areas Required to Achieve Outflow Concentrations of 30, 20, and 10 ppb.

Calculations are based upon the total potential load to each STA (actual predicted inflows + high-flow bypasses).   Hydraulic modifications may be needed in addition to increases in area to provide treatment of all flows (eliminate bypasses). 

Predicted areas to achieve 10 ppb outflow concentrations are based upon extrapolation of the STA design model outside of the range of data from exisiting constructed wetland treatment systems.   These projections are intended only to demonstrate sensitivity and should not be used for planning or design purposes.

Calculations are repeated for each BMP performance assumption (25%, 51%), each planning period (1965-1995 and WY 1979-1988), and for two Restudy scenarios (50Base & Alternative D13R).

Typical results for Alternative D13R are summarized below:

Sensitivity Analysis,  Combined Discharge from All STA's,   Alternative D13R

25% BMP Performance,  1965-1995

WCA-2A

STA Design

Low Est.

Water Col.

<-------- ENR Project -------->

Settling Rate (m/yr) 10.2 8.0 12.0 15.0 20.0
Outflow Concentrations (ppb) from ECP, Treatment Area = 39,918 acres

Outflow Conc (ECP)

56

68

48

38

26

Treatment Areas (acres) to Achieve Target Outflow Concentrations

Target =  30 ppb

67,673 87,934 56,944 44,045 33,413

Target = 20 ppb

87,856 114,937 73,674 58,066 42,922

Target = 10 ppb

128,024 172,283 105,995 82,477 60,279


Figures & Discussion (Alternative D13R, 25% BMP Performance, 1965-1995):

Tables (2050 Base Run & Alternative D13R):

Period of Record 65-95 65-95 79-88 79-88
BMP Performance 25% 51% 25% 51%
Sensitivity Analysis - for each STA   X X X X
Sensitivity Analysis - Summary for All STA's Combined X X X X


STA Outflow Concentration vs. Setting Rate

xcwca.gif (9032 bytes)

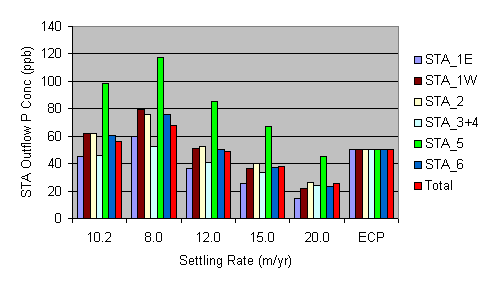
This chart shows predicted flow-weighted-mean concentrations in the outflows from each STA as a function of settling rate for 1965-1995 hydrologic conditions and BMP performance of 25%.   Treatment areas are fixed at ECP values.  Values assume treatment of all potential STA loads under Alternative D13R (STA inflows + high-flow bypasses).

Required Treatment Areas vs. Settling Rate & Target Conc.

xcwca.gif (9032 bytes)

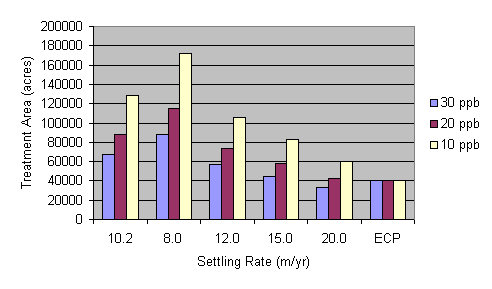
This chart shows the total STA treatment areas required to achieve outflow concentrations of 10, 20, and 30 ppb for Restudy Alternative D13R, 1965-1995 hydrologic conditions, and a BMP performance of 25%.  Areas are shown for 5 values of the settling rate and compared with ECP areas (sized to meet 50 ppb under WY 1979-1988 conditions).

STA & Reservoir Performance Measures

http://www.wwwalker.net/restudy/sensit.htm      Updated:  03/30/02