|

 Site Photos Site Photos
 Concentration Time
Series Concentration Time
Series
 Load Time Series
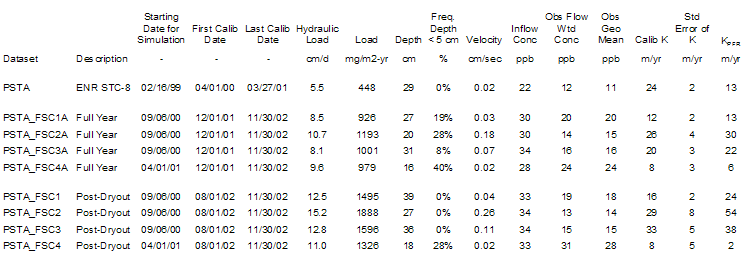
 Dataset Summary Dataset Summary
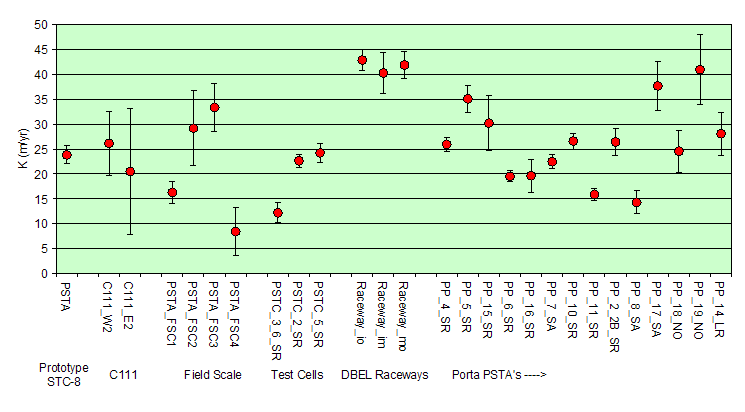
 Comparison of
Calibrated K values with other PSTA datasets Comparison of
Calibrated K values with other PSTA datasets
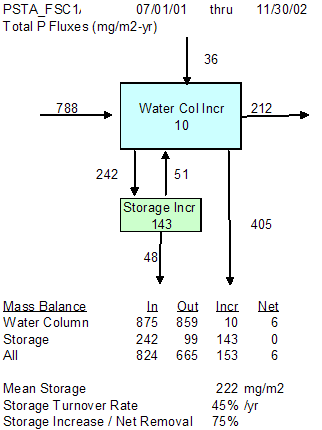
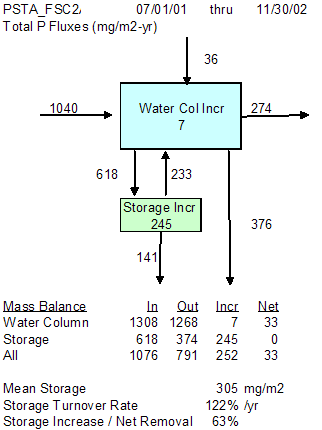
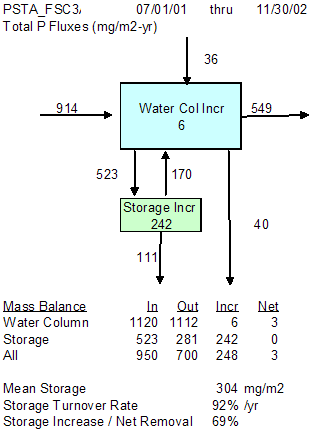
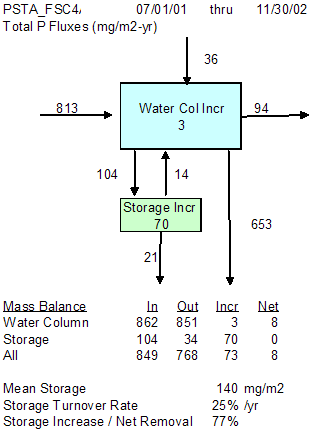
 Unit Area P Fluxes Unit Area P Fluxes
Sensitivity Analyses ( FSC-1)
 Outflow Seepage (0,
.1, .2) Outflow Seepage (0,
.1, .2)
 Stirred Tanks (3,
9, 25) Stirred Tanks (3,
9, 25)
|
Calibration Summary |
Prototype
Calibration* |
Mass
Balances |
CSTR's |
Calibrated K (m/yr) |
| Cell |
Description |
12/01 - 11/02 |
8/02 - 11/02 |
| FSC-1 |
Limerock |
 ~ NEWS ~ NEWS |
 |
9 |
 12 12 |
 16 16 |
| FSC-2 |
Limerock/High-Velocity |
 > SAV_C4 > SAV_C4 |
 |
25 |
 26 26 |
 29 29 |
| FSC-3 |
Caprock / Scraped |
 ~ SAV_C4 ~ SAV_C4 |
 |
4.2 |
 20 20 |
 33 33 |
| FSC-4 |
Peat |
 ~ EMERG ~ EMERG |
 |
9 |
 8 8 |
 8 8 |
* Observations compared with simulations using
parameter sets employed in SFWMD Basin Feasibility Studies (EMERG, NEWS,
SAV_C4).
All calibrations assume C0 = 4 ppb, C1 = 22 ppb, Zx = 0
cm. Hydraulic parameters calibrated separately for each
cell to match observed outflow and depth time series. Calibration procedures identical to those applied to
other DMSTA data sets.
K = 23 m/yr for PSTA Prototype
dataset (ENRP South Test Cell 8)
Some Observations:
- FSC 1-3 calibrations are within the range of
other PSTA platforms on substrates other than peat.
- FSC-1 performance is similar
to
NEWS calibration based upon ENR
Cell 4 & ENRP South Test Cell 8.
- FSC-2 performance is superior to the NEWS,
PSTA, or
SAV_C4 calibrations. The
improved performance relative to the ENRP STC-8 (basis for PSTA & NEWS
calibrations) may be related to effects of velocity (.18 vs. .02
cm/sec), hydraulic load (15 vs. 6 cm/d), or initial substrate P content
(~100 vs. ~800 mg/kg, CH2MHill Ex 3-36).
- FSC-3 performance is similar to SAV_C4
and superior to FSC-2 (K = 33 vs. 29 m/yr).
- FSC-4 (Peat) performance is similar to the emergent calibration (Boney Marsh).
This is consistent with data from
other PSTA platforms with a peat substrate.
- FSC-2 performs better than FSC-1 (K = 29
vs. 16 m/yr), even when adjusted for differences in hydraulics (TIS =
25 vs. 9) and seepage. The TIS difference accounts for
~1 ppb difference in predicted outflow
concentration. The higher K rate for FSC-2 is
consistent with the higher observed P storage in periphyton biomass (250
vs. 100 mg/m2, CH2 draft Ex 2-8). Differences in
performance could be related to effects of (1) velocity (0.18 vs.
0.02 cm/sec); (2) hydraulic load (15 vs. 12 cm/d); (3) P load
(1900 vs. 1400 mg/m2-yr); and/or (4) depth (20 vs. 27 m/yr).
Effects of velocity cannot be inferred directly by comparing FSC-2 & FSC-1 because they
were operated at
different hydraulic loads & depths.
- FSC 1-3 performance improved in the second operating period (after dryout), as measured by
K values and residual time series.
This general pattern was also observed in the ENRP PSTA test cells on
shellrock.
- Simulated mass balances indicate that
storage increase (P accumulation in biomass) accounted for 63-77% of
the net phosphorus uptake between July 2001 & November 2002. This suggests that
the systems did reach steady-state (mat communities may not have
fully developed) & is consistent with improved performance in the
later (post-dryout, August-Nov 2002) calibration period.
- The model tends to over-predict outflow concentrations during periods
of high loading and to under-predict concentrations during period of low
loading. Refinements of the model calibration and/or structure may
be needed to improve the simulations. However, this pattern may be
related to P releases from initial substrates, which are not reflected in
the simulations.
- Calibrated net outflow seepage rates are 0.1, 0.13, 0.01, and 0.22
cm/day/cm for FSC 1, 2 & 4, respectively.
- Calibration of FSC-2 may be influenced by inflow seepage from adjacent
FSC-1. If all of the latter is assumed to enter FSC-2 (uniformly
distributed), the calibrated K value for FSC-2 increases from 29 to 35
m/yr.
- FSC-1 performance is moderately
sensitive to seepage rates over a range of 0 to 0.2 cm/day/cm; the
calibrated value (0.1) is relatively well-determined based upon observed
outflow volume & depth time series.
- Simulations assume that outflow seepage is distributed uniformly over
each cell. If all of the seepage is assumed to occur in the inlet
region, calibrated K values decrease from 16 to 13 m/yr in
FSC-1 and from 29 to 23 m/yr in
FSC-2.
- Effects of P loading from initial substrates may be reflected by the
following performance ranking of
K values for PSTA datasets:
[Raceway / FS Scraped / PP-NoSubstrate] > [ Shellrock / Limerock
] > Peat.
- Extrapolation of FSC calibrations to full-scale systems may depend
upon whether the relatively shallow depths (<~ 40 cm) can be
maintained while passing peak flows through the STA's.
|

