|
DMSTA Application to Existing Stormwater Treatment Areas 06/28/2002 Existing calibrations of DMSTA have been tested partially on data from small-scale experimental platforms operated for short periods and steady inflows (mesocosms, test cells). While data from the 3800-acre Everglades Nutrient Removal Project have also been used extensively, this system was also operated with relatively steady inflows and depths until STA-1W came on line in July 2000. Refining the structure and calibration of the model based upon additional data from full-scale systems with dynamic inflows will provide an improved basis for designing future treatment areas and/or optimizing the existing ones. Accordingly, current efforts focus on the compilation and simulation of data from large-scale systems, including operating STA's, individual STA cells, and Water Conservation Area 2A. This exercise allows:
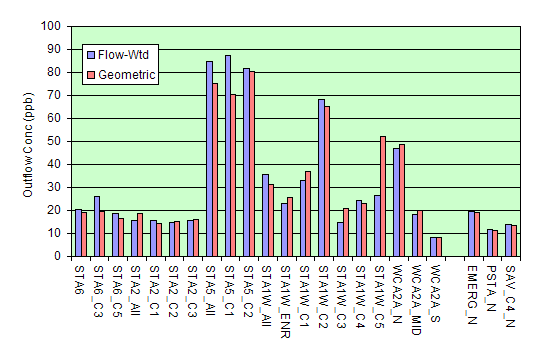
Interpretation of results is complicated by the fact that some of the systems are still in a startup/stabilization mode & the model is not designed to simulate this period. Another complicating factor is that monitoring systems are still being refined (e.g., calibration of flow & stage recorders, installation of auto-samplers). Recommendations for improving monitoring networks can be made based upon any data deficiencies identified in the process of compiling the datasets. Data-reduction procedures (selection of appropriate flow and concentration datasets, estimation of missing values, screening of outliers, computation of loads) are also subject to refinement. Results summarized below are based upon provisional data collected through March 2002. Dataset characteristics are summarized in the attached table and figures. Observed flow-weighted and geometric means for each dataset during the period used for model calibration/testing (i.e., after the model initialization period) are shown below:
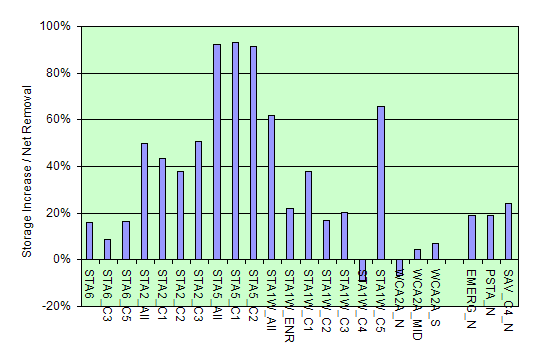
Values are also shown for the calibration prototype datasets (EMERG = Boney Marsh, PSTA = South Test Cell 8, & SAV_C4 = ENRP Cell 4 during its "optimal performance period" (1998-1999). In the context of DMSTA's P cycling model, phosphorus removal during any period reflects the sum of burial (soil accretion) and increase in P storage. As the systems mature and biomass P approaches a dynamic steady-state, the burial term will dominate. The ratio of the storage increase to net P removal for any period is one measure of stabilization:
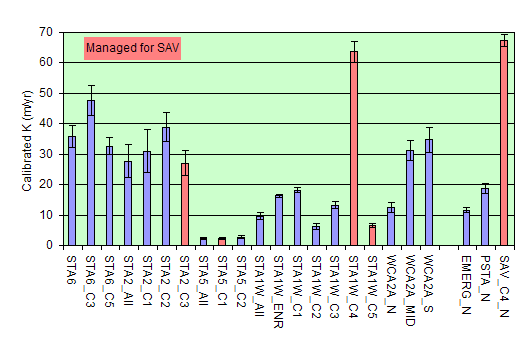
P uptake in STA5 and STA1W-C5 is primarily attributed to storage increase. As the systems are operated for longer periods, the ratio will decrease, performance (and calibrated K values) will be more reflective of long-term conditions. Based upon residuals analysis, this factor does not appear to have had a strong influence on model calibrations to mesocosm and test cell datasets, however. The model has been calibrated to each dataset by adjusting the net settling rate (K, m/yr) to minimize the residual sum of squares of the log-transformed concentrations. This essentially amounts to calibrating the model to the geometric mean. This exercise has been performed for assumed C0 values of 4 ppb and 2 ppb. The remaining input parameter (C1) has been fixed at 22 ppb. This parameter primarily determines the scale of the phosphorus storage term and has little impact on the predicted outflow concentrations. The attached graphs show that residual standard errors are lower with C0= 2 ppb as compared with C0 = 4 ppb for most datasets, particularly for outflow loads. With C0= 4 ppb, the model over-predicts the observed flow-weighted mean concentration (hence, outflow load) in most of these datasets. Residuals plots reveal a tendency to over-predict concentrations during periods of high flow. In other words, the systems are more resilient to pulsing than predicted. This is a concern because treatment areas are being designed to meet both geometric and flow-weighted outflow concentration objectives (< 10 ppb and < 15 ppb, respectively). The pattern was not identified in testing the model against experimental datasets, most of which were operated in relatively stable flow regimes. With C0 = 2 ppb, the calibrations provide acceptable fits of both the geometric and flow-weighted means. Decreasing C0 has the effect of increasing the turnover rate of the storage pool at a given water column concentration. This, in turn, allows the system to absorb pulse inputs with less increase in outflow concentration. Decreasing C0 from 4 to 2 ppb is also improves the fit of the outflow concentration time series in the calibration prototype datasets with pulsed inputs (Boney Marsh, Cell 4). It degrades the fit of most of the SAV mesocosm and test cell datasets, however, particularly in the low concentration range. These revised calibrations can be used for design purposes only if one is willing to reject those experimental datasets as unrepresentative for one reason or other. Further analysis is recommended to resolve these discrepancies. The following figure shows calibrated K values for each dataset with C0 = 2 ppb:
Error bars show means +/- one standard error. Cells managed to promote SAV are shown in red. Generally, the systems can be grouped in 2 categories:
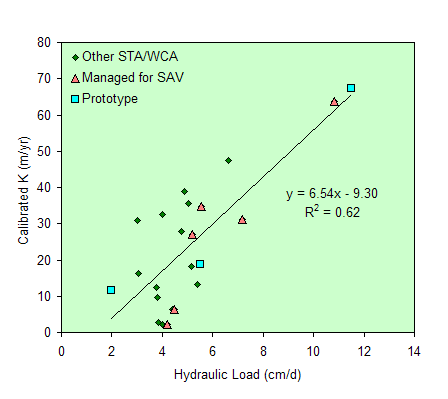
This overall spatial pattern apparently dominates over vegetation management effects. With the exception of STA1W-C4, cells managed to promote SAV (STA2-C3, STA5-C1, STA1W-C5) have K values that are similar to those of unmanaged cells within each STA. Performance may improve, however, after the systems have been operated for longer periods, as was observed in the case of STA1W-C4. The calibrated K values are correlated with hydraulic load (r2 = 0.62):
A similar pattern is evident in the mesocosm & test cell data. While the reasons for this correlation need to be explored, it suggests that extrapolating the high K value measured in STA-1W Cell-4 to treatment cells with lower hydraulic loadings that are more typical of other STA cells would be risky at best. Other factors potentially responsible for K variations include soil characteristics, actual vegetation communities, hydrilla infestation, inflow SRP/TP ratio, calcium, system age, and hydraulic efficiency. Sorting out these factors will provide a partial basis for STA optimization efforts. It is clear from this analysis that designating and managing a treatment cell as "SAV" does not guarantee Cell4-like performance. Other observations relevant to use of the model in a design mode include:
Designs should be based upon site-specific estimates of these parameters. Values supplied previously in sample datasets were intended for demonstration purposes only and should not be considered "typical" or "default" values. Detailed simulation results are presented below. Output formats include:
06/28/2002 |
||||||||||||||||||||||||||||||||||||||||||||||||||||||||||||


